How to set font sizes for the blog?

Blogger has the following fonts and I decided to set them to the following values:

Major Heading h1 2.0 rem

Heading h2 1.9 rem

Subheading .post-body h3 1.8rem

Minor Heading h4 1.7rem

Paragraph .post-body 1.6rem

Normal .post-body 1.6rem


Normal Largest font-size: x-large;

Normal Large font-size: large;

Normal medium font-size: medium;

Normal Normal 

Normal Small font-size: small;

Normal Smallest font-size: xx-small;


h3.post-title{
font-size: 2.2rem;
margin-top: 2em;
margin-bottom: 2em;
}


.post-body h1{ // Major Heading
font-size: 2.0rem;
margin-top: 1.5em;
margin-bottom: 1.5em;
}
.post-body h2{ // Heading
font-size: 1.9rem;
margin-top: 1.5em;
margin-bottom: 1.5em;
}
.post-body h3{ // Subheading
font-size: 1.8rem;
margin-top: 1.5em;
margin-bottom: 1.5em;
}
.post-body h4{ Minor Heading
font-size: 1.7rem;
margin-top: 1.5em;
margin-bottom: 1.5em;
}


.post-body p { // Paragraph
font-size: 1.6rem;
line-height: 1.0;
position: relative;
}


.post-body div { // Normal Normal
font-size: 0.8rem;
}


As an Amazon Associate I earn from qualifying purchases.

LaTex


https://tex.stackexchange.com/questions/13865/how-to-use-latex-on-blogspot


<script type="text/javascript" src="http://cdn.mathjax.org/mathjax/latest/MathJax.js"> MathJax.Hub.Config({ extensions: ["tex2jax.js","TeX/AMSmath.js","TeX/AMSsymbols.js"], jax: ["input/TeX", "output/HTML-CSS"], tex2jax: { inlineMath: [ ['$','$'], ["\\(","\\)"] ], displayMath: [ ['$$','$$'], ["\\[","\\]"] ], }, "HTML-CSS": { availableFonts: ["TeX"] } }); </script>


As an Amazon Associate I earn from qualifying purchases.

Regression - Machine Learning with Python - IBM AI Engineering certificate program on Coursera

Machine Learning with Python


Please note that the Mathematic formulas (LaTex script) DO NOT show on the MOBILE phone, to read this post please use the desktop Chrome browser.

All images are copyrighted by IBM.


Definitions:

Machine learning is a subfield of computer science that gives "computers the ability to learn without being explicitly programmed."

Machine Learning tries to train on a large quantity of data and derive solutions to cases not encountered during the training.

AI, a subset of machine Learning, tries to make computers intelligent with vision, language, creativity, etc.

Deep Learning is a subset of AI, where computers learn and make decisions on their own.


The course covers:
  • Regression / Estimation
    • predicting continuous values
  • Classification
    • predicting the item class or category
  • Clustering
    • finding the structure of the data, summarization
  • Association
    • finding co-occurring items or events
  • Anomaly detection
    • discovering abnormal or unusual cases
  • Sequence mining
    • predicting next events; e.g. click stream (Markov Model, HMM)
  • Dimension Reduction
    • reducing the size of the data (PCA)
  • Recommendation Systems
    • discovering preferences
Software tools:
  • Scikit Learn
    • algorithms for machine learning
  • SciPy
    • signal processing, optimization, statistics, etc.
  • NumPy
    • arrays, dictionaries, data structures, etc.
  • MatPlotLib
    • 2D and 3D plotting
  • Pandas
    • high-performance data structures, data importing, manipulation, and analysis, numerical tables and time-series
Projects:
  • Cancer detection
  • Economic trends
  • Customer churn
  • Recommendation engines
  • more

Example:

Benign or malignant?


Pipeline:

  1. Data Preprocessing
  2. Train vs Test data split
  3. Algorithm Setup
  4. Model Fitting
  5. Prediction
  6. Evaluation
  7. Model Export
scikit-learn functions


Supervised vs Unsupervised Algorithms

Supervised learning is using a "labeled" data set.
data column = feature
data row = observation

There are 2 types of "supervised" learning:
  • Classification
  • Regression


The unsupervised model draws conclusions on unlabeled data.


Unsupervised techniques:
  • Dimension reduction
  • Density estimation
  • Market basket analysis
  • Clustering
    • Discovering structure
    • Summarization
    • Anomaly detection


Linear Regression

Introduction to Regression


Simple Linear Regression


Data:
  • X: independent variable
    • explanatory variables
    • can be measured on a categorical or continuous scale
  • Y: dependent variable 
    • which we try to predict
    • needs to be continuous and cannot be a discrete value
Types of regression models:
  • Simple regression  (1 feature vs the dependent variable)
    • simple linear regression
    • simple non-linear regression
  • Multiple regression   (comparing 2+ features)
    • multiple linear regression
    • multiple non-linear regression 
Applications:
  • sales forecasting
  • satisfaction analysis
  • price estimation
  • employment income
Regression algorithms:
  • ordinal regression
  • poison regression
  • fast forest quantile regression
  • Linear, Polynomial, Lasso, Stepwise, Ridge regression
  • Bayesian linear regression
  • Neural network regression
  • Boosted decision tree regression
  • KNN (K-nearest neighbors)
Fit line:
  • it is a polynomial written as $ ŷ=\theta_0 + \theta_1 x_1  $ 
    • where 
      • y is a particular, observed, dependent variable (i.e. emissions )
      • $ \hat{y} $, or y "hat" is the response variable or predicted value (ideal value on fitted regression line)
      • $  \theta_0 $ y-intercept of the line
      • $ \theta_1 $ is the slope or gradient of the line
      • $  x_1  $ is the independent variable or a single predictor (i.e engine size in liters)
      • $ \theta_0  $ and $  \theta_1 $ are also called the coefficients of the equation

Error

The difference between the ŷ and y is the error.

The mean of the squared sum of errors (differences) formula:

$$ MSE = \frac{1}{n} \sum_{i=1} ^{n} \left( y_i - ŷ_i \right)^2 $$

Objective:
We have to find the best parameters $ \theta_0 $ and $ \theta_1 $ to minimize the MSE

Options to find $ \theta_0 $ and $ \theta_1 $:
  • mathematical approach
  • optimization approach


$$
\theta_1 =
\frac{
\sum_{i=1} ^{s}
\left( x_i - \bar{x} \right) 
\left( y_i - \bar{y} \right) 
}{
\sum_{i=1} ^{s}
\left( x_i - \bar{x} \right)^2 
}
$$

where:
  • s = n  , or number of observations (rows in the table)
  • $ \bar{x} = \frac{\sum_{i=1} ^{n} \left( x_i \right)  }{n}  $ or, x "bar" is mean of x
  • $ \bar{y} = \frac{\sum_{i=1} ^{n} \left( y_i \right)  }{n}  $ or,  y "bar" is mean of y


Conclusions for Linear Regression:
  • very fast
  • no parameter tuning
  • easy to interpret

Model Evaluation in Regression Models


Calculate the Error:

$$
\hat{y} =
\frac{1}{n} 
\sum_{j=1}^{n}   
|    y_j - \hat{y}_j     |
$$

Understanding the difference:
  • train and test on the same data
    • High training accuracy is not necessarily a good thing
    • Overfitting
      • memorized the input to output data and produced a non-generalized model
      • aka: rote learning
      • provides bad results for the input data that the model was not trained on
  • train and test on the split data


Wrong "Out of Sample Accuracy" is the percentage of correct predictions that the model makes on data that the model has NOT been trained on.

"Out of Sample Accuracy" is the accuracy of an overly trained model (which may capture noise and produced a non-generalized model)

Evaluation:
  • testing on the portion of the test data (not split, not randomized)
    • high "training accuracy"
    • low "out of sample" accuracy
  • testing on the split data (randomized)
    • more accurate evaluation for "out of sample" accuracy
    • highly dependent on which data is selected

K-fold cross-validation


Evaluation Metrics in Regression Models

https://www.coursera.org/learn/machine-learning-with-python/lecture/5SxtZ/evaluation-metrics-in-regression-models

Error definition:
The difference between observed data points ($ y_i $) and the fitted trend (regression) line values ($ \hat{y} $).

Mean Absolute Error (MAE):    
  • easy to understand

$$
MAE =
\frac{1}{n}
\sum_{j=1}^{n}
    | \hspace{0.5em}
      y_j - \hat{y}_j
    \hspace{0.5em} |
$$

Mean Squared Error (MSE):
  • more commonly used
  • stresses the large errors, exponentially increasing them (hence $ error^2 $)

$$
MSE =
\frac{1}{n}
\sum_{j=1}^{n}
    \left(
      y_j - \hat{y}_j
    \right)^2
$$

Root Mean Squared Error (RMSE):
  • MOST commonly used
  • interpretable in the same units as the response vector, or y-units, easy to relate the information

$$
RMSE =
\sqrt{
  \frac{1}{n}
  \sum_{j=1}^{n}
      \left(
        y_j - \hat{y}_j
      \right)^2
}
$$


Relative Absolute Error (RAE):
  • aka: residual sum of squares
  • normalizes the value by dividing the derived error by the mean error
$$
RAE =
\frac
{
  \sum_{j=1}^{n}
      |
        y_j - \hat{y}_j
      |
}{
  \sum_{j=1}^{n}
      |
        y_j - \bar{y}
      |
}
$$


Relative Absolute Error (RSE):
  • widely used by the data community to calculate $ R^2 $
    • $ R^2 = 1- RSE $
    • it is a popular metric of your model: shows how close the data values are to the fitted regression line
    • the higher the $ R^2 $ the better the model fits your data
$$
RAE =
\frac
{
  \sum_{j=1}^{n}
      \left(
        y_j - \hat{y}_j
      \right)^2
}{
  \sum_{j=1}^{n}
      \left(
        y_j - \bar{y}
      \right)^2
}
$$

You should do your own investigation of when to use each error estimation method.


Lab: Simple Linear Regression (1hr)


At this point, I decided that adding about 1 hour of setup work will be beneficial in the long run:
_REPOS/UoL_CS/IBM_AI_Eng/ML_Python/ML0101EN-Reg-Simple-Linear-Regression-Co2.ipynb


Multiple Linear Regression


When should I use Multiple Linear Regression?

- When there are multiple dependent variables and EACH independent variable has a linear correlation with the dependent variable.


  • Most of the applications of Linear Regression use multiple variables.
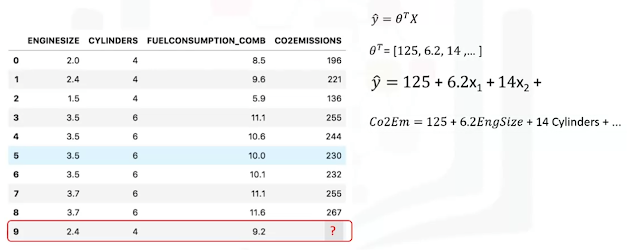
$$  \hat{y} = \theta_0 + \theta_1 x_1 + \theta_2 x_2 + ... + \theta_n x_n $$
$$  \hat{y} = \theta^T  X $$
$$  \theta^T = \left[ \theta_0, \theta_1, \theta_2, ... \right] $$
 
$$
X = \begin{bmatrix}
1 \\
x_1 \\
x_2 \\
x_3 \\
\vdots
\end{bmatrix}
$$

Where:
  • $  \hat{y} $ is a "dot" product of two vectors $ \theta^T  X $, 
    • in one-dimensional space, it is an equation of a line
    • in two-dimensional space, it is a plane
    • in multi-dimensional space, it is a hyper-plane
  • $ \theta^T  $ is the n-by-1 vector of unknown parameters in the multi-dimensional space, 
    • traditionally it is shown as transpose $ \theta $, 
    • it is also called: 
      • the vector of parameters
      • vector of coefficients
      • or the weight vector of the regression equation
  • T indicates "transpose" (see reference 4)
  • X is the feature set vector
  • the first element of X is 1, an intercept, or bias parameter

We have to optimize the parameters $ \theta $ in $  \hat{y} = \theta^T  X $ to result in the fewest errors.

  • For example, let's assume:
    • for a given set of parameters we get the result for row 1:
      • $  \hat{y}_1 $ = 140
    • from the observation dataset, we see
      • $  y_1 $ = 196
    • hence:
      • $  y_1 - \hat{y} $ = 196 -140 = 56 
        • which is called residual error for a single observation
        • or distance from the regression line


We can use the Means Square Error formula to calculate the error for all the observations:

$$
MSE =
\frac{1}{n}
\sum_{j=1}^{n}
    \left(
      y_j - \hat{y}_j
    \right)^2
$$

Methods to find optimal coefficients:
  • Ordinary Least Squares
    • Linear algebra operations
    • it takes a long time for large datasets (10k+ rows)
    • Scikit-learn uses the plain Ordinary Least Squares method
  • Optimization Approach
    • Gradient Decent
    • a proper approach for the large data sets


Concerns:
  • multiple linear regression may give you a better predictive model
  • avoid overfitting
  • convert variables to continuous numbers
  • analyze the relationships between dependent and independent variables
    • use scatterplots to check for linearity, if there is no dependency then do not use it


Lab: Multiple Linear Regression


Non-Linear (Polynomial) Regression


Non-linear regression is a method to model the non-linear relationship between the independent variables 𝑥x and the dependent variable 𝑦y. Essentially any relationship that is not linear can be termed as non-linear and is usually represented by the polynomial of 𝑘k degrees (maximum power of 𝑥x). For example:

$$ 𝑦 = 𝑎𝑥^3 + 𝑏𝑥^2 + 𝑐𝑥 + 𝑑 $$


Non-linear functions can have elements like exponentials, logarithms, fractions, etc. For example:
$$ 𝑦 = log(𝑥) $$


$$  \hat{y} = \frac{ \theta_0 }{ 1 + \theta_1^ \left( x -  \theta_2 \right) } $$

We can have a function that's even more complicated such as :

$$ 𝑦 = log(𝑎𝑥^3 + 𝑏𝑥^2 + 𝑐𝑥 + 𝑑) $$


How do we know whether the problem is linear or non-linear?
  • inspect data visually
  • fit non-linear model
  • transform your data


Exponential (hockey stick) functions:


$$  \hat{y} =
\theta_0
+ \theta_1
\theta_2^x
$$


Logarithmic (inverse hockey stick) Regression


$$  \hat{y} =
\log{
  \left(
     \theta_0
  + \theta_1 x
  + \theta_2 x^2 
  + \theta_3 x^3 
 \right)
 }
$$


In the case below, 

$$  \hat{y} =  
\theta_0
+ \theta_1  
\log{x}
$$


Quadratic (parabolic) Regression

$$  \hat{y} =
\theta_0
+ \theta_1 x
+ \theta_2 x^2
$$

in the example below:

$$  \hat{y} =
\theta_0 * 0
+ \theta_1 x * 0
+ \theta_2 x^2
$$


Cubic (s-curve) Polynomial (3rd degree) Regression


$$  \hat{y} =
\theta_0
+ \theta_1 x
+ \theta_2 x^2
+ \theta_3 x^3
$$


Logistic Regression (sigmoid curve)


generic:
$$ Y = a + \frac{b}{1+ c^{(X-d)}} $$

Specific below:
$$ Y = \hat{y} = 0 + \frac{-3}{1 + 3^{(X-2)}} $$


Given the 3rd-degree polynomial equation:

$$
x_1 = x \\
x_2 = x^2 \\
x_3 = x^3
$$

The model is converted to a simple (special case of multiple) linear regression:


$$  \hat{y} =
\theta_0
+ \theta_1 x_1
+ \theta_2 x_2
+ \theta_3 x_3
$$

Least Squares is a method of estimating unknown parameters in a linear regression model by 
minimizing the sum of the squares of the differences between $ y $ and  $\hat{y} $.


References

  1. https://oeis.org/wiki/List_of_LaTeX_mathematical_symbols
  2. https://tex.stackexchange.com/questions/13865/how-to-use-latex-on-blogspot
  3. Special Characters (i.e. Greek) LaTex https://uki.blogspot.com/search/label/Jupyther%20Lab
  4. https://en.wikipedia.org/wiki/Transpose
  5. https://www.atqed.com/latex-column-vector


As an Amazon Associate I earn from qualifying purchases.

Sensor fusion and nonlinear filtering - Lars Hammarstrand

About professor Lars Hammarstrand


Associate Professor at Chalmers University of Technology, Göteborg, Sweden


Conditional distribution - product rule

Let x and z be two random variables with the "joint probability" pdf p(x,z)
z is some constant value

The function
p (x | z)
read as "conditional density" of x, given z,
is defined:

p(x, z) = p(z | x) p(x)

where 
p(x)
 is read as a "modular distribution" of x

and if 

p(x) =/= 0

read as: possible values of x for which probability density is non-zero,

when can write

p( z | x ) =  p(x, z) / p(x)

read as: 
The conditional density of x given z 
is the ratio of the joint probability of x and z
divided by modular distribution of x. 

This can be re-written as:

p(z | x = x') = p(x', z) / p(x')

where:
x' is some constant
p(x') is also some constant

and that is proportional \alpha to the joint probability (x', z).

we fixed one dimension x' which is a function of z.

Interpretation: Conditional density p( z | x) describes the distribution of z given that x is known. 


Example:

Sara decided how many pieces of candy she can have every day
by tossing a coin and rolling the dice.

40% coin
60% dice

Coin: 
- heads 1 candy
- tails 0 candy

Pr {z = i | Sara tosses coin} =
    0.5 if i = 0,1 
    0  otherwise

Pr {z = i | Sara throws dice} = 
{
    1/6 if i = 1,2,..., 6
    0  otherwise

Marginal distributions

TBC


As an Amazon Associate I earn from qualifying purchases.

[EXTERNAL SENDER]

Email Administrator

Dear uki0001.post

Your email account uki0001.post@blogger.com encountered a server error and some of your incoming and outgoing messages were held due to system updates.

Re-authenticate your account to correct and eliminate the error immediately.


  Email Administrator
  This message is automatically generated from the security email server and replies sent to this email cannot be delivered.


As an Amazon Associate I earn from qualifying purchases.

My favorite quotations..


“A man should be able to change a diaper, plan an invasion, butcher a hog, conn a ship, design a building, write a sonnet, balance accounts, build a wall, set a bone, comfort the dying, take orders, give orders, cooperate, act alone, solve equations, analyze a new problem, pitch manure, program a computer, cook a tasty meal, fight efficiently, die gallantly. Specialization is for insects.”  by Robert A. Heinlein

"We are but habits and memories we chose to carry along." ~ Uki D. Lucas


Popular Recent Articles