https://uki.blogspot.com/2022/09/ibmaiengineering.html
Please note that the Mathematic formulas (LaTex script) DO NOT show on the MOBILE phone, to read this post please use the desktop Chrome browser.
All images are copyrighted by IBM Developer Skills Network.
Table of Contents
Introduction to Classification
What is classification?- Classification is a supervised machine learning approach
- Categorizing some unknown items into a discrete set of categories or "classes".
- Relationship between "feature" variables and the target attribute which is a categorical variable.

What is multi-class classification?
Multi-class classification can predict the target attribute (a field) with multiple discrete values to choose from.What are examples of Multi-class classification use cases?
- category to which the person belongs
- churn detection: person switching brand loyalty
- detect if a person responds to a particular advertising campaign

What are the types of classification algorithms?
- Decision Trees (ID3, C4.5, C5.0)
- Naïve Bayes,
- Linear Discriminant Analysis
- k-Nearest Neighbor
- Logistic Regression
- Neural Networks (DNN)
- Support Vector Machines (SVM)
k-Nearest Neighbors (kNN)
K-Nearest Neighbors is a supervised learning algorithm. Where the data is 'trained' with data points corresponding to their classification. To predict the class of a given data point, it takes into account the classes of the 'K' nearest data points and chooses the class to which the majority of the 'K' nearest data points belong as the predicted class.
- The kNN algorithm is a classification algorithm
- The kNN algorithm classifies classes on their similarity to other classes
- The kNN can work with Minkowski/Eucleadian distance, but it does not have to.
- The large, or the small, size of k in kNN does guarantee a good model, rather the k value needs to be found empirically.
- kNN can be used to compute a continuous value, for example, the price of a home
How to determine which class?
Find several nearest neighbors in the data (e.g. age, income, etc.) and determine (vote) to which class they should belong.

This can be done using Euclidean Distance [reference 1].


How does the k-Nearest Neighbor work?
- pick a value for K
- calculate the distance of the unknown case from all cases
- select the k-observations in the training data that are "nearest" to the unknown data point
- predict the response of the unknown data point the most popular response value from the K-nearest neighbors.
How to select the K-value?
- too small of the k sample may capture the "noise" in the data (an outlier)
- a low value of k makes for a very complex model which may result in overfitting of the model
- too large of the k can make the model overgeneralized
- reserve part of your data to test the distribution of accuracy of the model for various k= 1 to n
How to calculate the distance between k-neighbors?
- We can use the Minkowski distance (aka Euclidean distance)
- normalize the unites
Minkowski \ distance (x_1, x_2) =
\sqrt{
\sum_{i=0}^{n}
\left(
x_{1i} - x_{2i}
\right)^2
}
$$
Example (not normalized):
- person 1
- age 34
- income 190
- education 3
- person 2
- age 30
- income 200
- education 8
$$
Minkowski \ distance (x_1, x_2) =
\sqrt{
\sum_{i=0}^{n}
\left(
x_{1i} - x_{2i}
\right)^2
}
$$
Minkowski \ distance (x_1, x_2) =
\sqrt{
\sum_{i=0}^{n}
\left(
x_{1i} - x_{2i}
\right)^2
}
$$
$$ = \sqrt{ \left( 34 - 30 \right)^2 + \left( 190 - 200 \right)^2 + \left( 3 - 8 \right)^2 } \\ = 11.87 $$
Evaluation Metrics in Classification
Harmonic Mean [see references 2, 3 ]
$$ harmonic \ mean = \frac{2*A*B}{A+B} $$
Classification Accuracy
compare the historical actual data $ y $ vs predicted values $ \hat{y} $
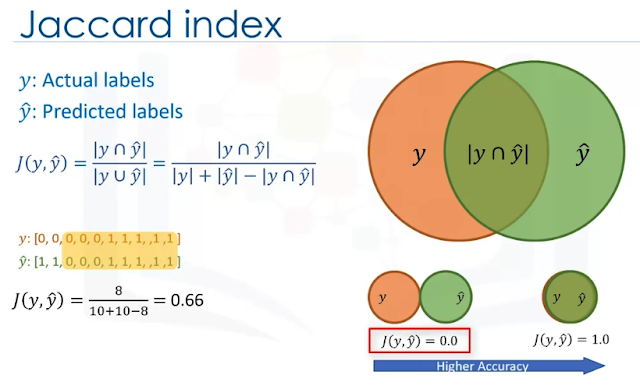
- Jaccard index (similarity coefficient, intersection-over-union)

- F1 score (Confusion matrix)
- TP = True Positives
- FN = False Negatives
- FP = False Positives
- TN = True Negatives
- precision = TP / (TP + FP)
- use when identifying positives is a priority
- example: classify butterfly species
- recall = TP / (TP + FN)
- use when false negatives are a problem
- example: identify non-existing obstacles at highway speed
- F1 score is a harmonic mean of the precision and recall scores
- F1 score = $ \frac{2 * precision * recall}{precision + recall} $
- Finally, we can average multiple F1 score results

Logarithmic (Log) Loss
- Sometimes the output is the probability of the class label
- continuous values between 0 to 1 (or 0 to 100%, or NO to YES)
- Log Loss measures the performance of the classifier where the output is a probability
$$ error = y \cdot log(\hat{y}) + ( 1 -y ) \cdot \log(1 - \hat{y}) $$
Where:
- $ \hat{y} $ is a predicted result
- y is the actual observed result
Then, we can calculate the Log Loss as an average across all observations (rows n):
$$ LogLoss = - \frac{1}{n} \sum_{i=1}^{n} ( error_i ) $$
The classifier with the lower Log Loss has better performance.

Lab: kNN
References
- https://en.wikipedia.org/wiki/Euclidean_distance
- https://en.wikipedia.org/wiki/Harmonic_mean
- https://en.wikibooks.org/wiki/Statistics/Summary/Averages/Harmonic_Mean
- https://www.coursera.org/learn/machine-learning-with-python/lecture/5iCQt/evaluation-metrics-in-classification
- lab kNN: https://www.coursera.org/learn/machine-learning-with-python/ungradedLti/pUIUL/lab-knn


